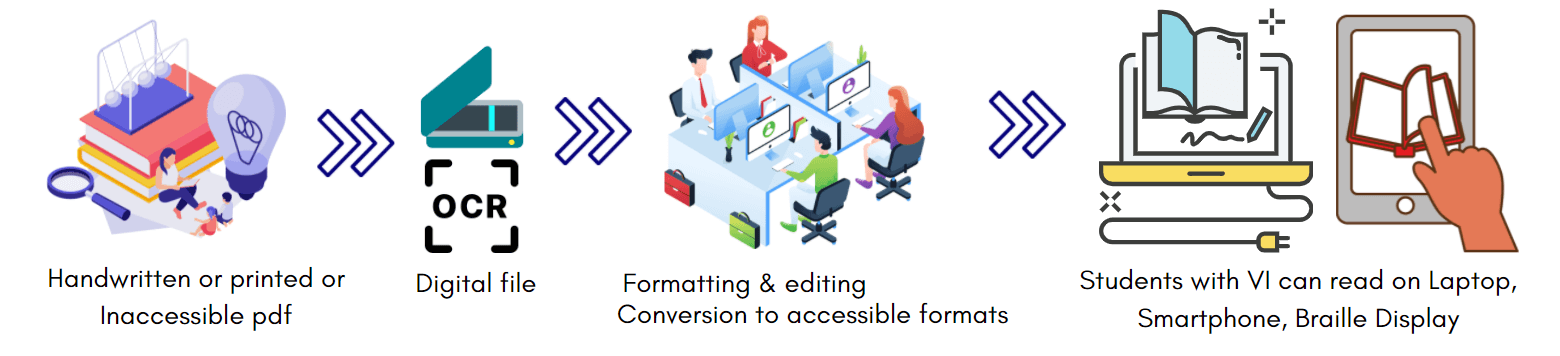
Raised Lines Foundation is working towards providing inclusive reading and learning resources for persons with print disabilities like blindness and low vision. In this new initiative we are making digital content accessible with special focus on accessibility of STEM content. Our service transform your content from traditional print or handwritten sources into modern, accessible web content and ePubs. If you have any inaccessible PDF/DOCX/ePub/HTML document or book to be made accessible,then submit your content and our team will reach out to you.
Submit ContentIrrespective of the structure of the PDF documents our experts can make STEM documents accessible in different formats to ensure it is easily readable and navigable by assistive technologies like screen readers, brailled display and smartphones
As e-books and web documents continue to rapidly replace printed books, it is becoming increasingly important to ensure their inclusivity. We understand and evaluate accessibility requirements to transform your content.
The access barriers of PDF files and MS office documents(.docx,.xlsx and .ppt) are removed through correct tagging and restructuring of the files in compliance with WCAG 2.1 guidelines.
For several STEM images and diagrams the alt text descriptions and interactive SVGs are not enough. In these cases creating a tactile supplement makes a lot of sense. For e.g. maps and biology diagrams
The math is made accessible and can be read in all browsers. The math equations scales with the surrounding text.
For example, the mean \(\overline{x}\) of the data is given by
\[\overline{x} = \frac{f_{1}x_{1} + f_{2}x_{2} + \cdots + f_{n}x_{n}}{f_{1} + f_{2} + \cdots + f_{n}}\]
The given math equation scales with the surrounding text. The screen reader users can navigate within the equation to comprehend them by just pressing enter and using up and down arrow keys
Our accessible chemical equations and diagrams scale with the surrounding text when zoomed. They also contain alternate text descriptions for screen reader users, for example
Tables are made easily navigable and comprehendable, for example
| Class interval | Number of students (\(f_{i}\)) | Class mark (\(x_{i}\)) | \[f_{i}x_{i}\] |
|---|---|---|---|
| 10-25 | 2 | 17.5 | 35.0 |
| 25-40 | 3 | 32.5 | 97.5 |
| 40-55 | 7 | 47.5 | 332.5 |
| 55-70 | 6 | 62.5 | 375.0 |
| 70-85 | 6 | 77.5 | 465.0 |
| 85 - 100 | 6 | 92.5 | 555.0 |
| Total | \[\Sigma f_{i} = 30\] | \[\Sigma f_{i}x_{i} = 1860.0\] |
The diagrams are made accessible with the help of SVGs. For eg. the cartesian plane given below